Statistics
Project statistics
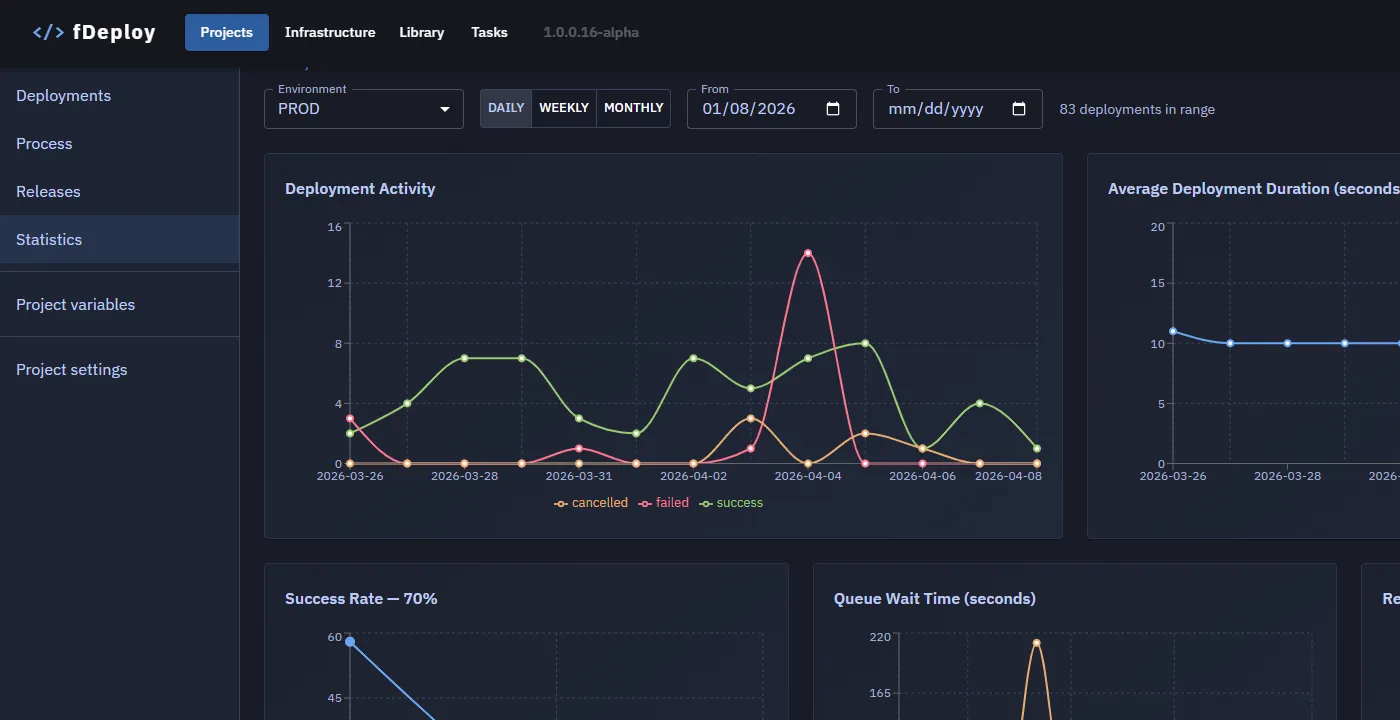
The Statistics page provides visual insights into deployment activity for a project. It is accessible from the left sidebar when viewing a project.
Filters
All charts respond to the filter bar at the top of the page:
- Environment — select which environment to display statistics for. An environment must always be selected.
- Granularity — toggle between Daily, Weekly, and Monthly grouping for time-based charts.
- Date range — optional From and To date fields to narrow the time window. Defaults to the last quarter.
Charts
Deployment Activity
Shows the number of deployments over time, broken down by outcome: success, failed, and cancelled. Useful for spotting trends in deployment frequency and failure rates.
Average Deployment Duration
Displays the average duration (in seconds) of successful deployments over time. When the selected environment contains deployments, the chart shows a line for each environment with data in the selected period.
Success Rate
Displays the total count of successful, failed, and cancelled deployments in the selected range, with the overall success percentage shown in the chart title.
Queue Wait Time
Shows how long deployments waited in the queue before execution started. Two lines are displayed:
- Avg — the average queue wait time per period.
- Max — the longest queue wait time per period.
This chart helps identify periods where deployments were delayed due to queue congestion.
Release Frequency
Tracks how many releases were created per period. This chart reflects release cadence and is filtered by date range and granularity, but not by environment.