Diagnostics
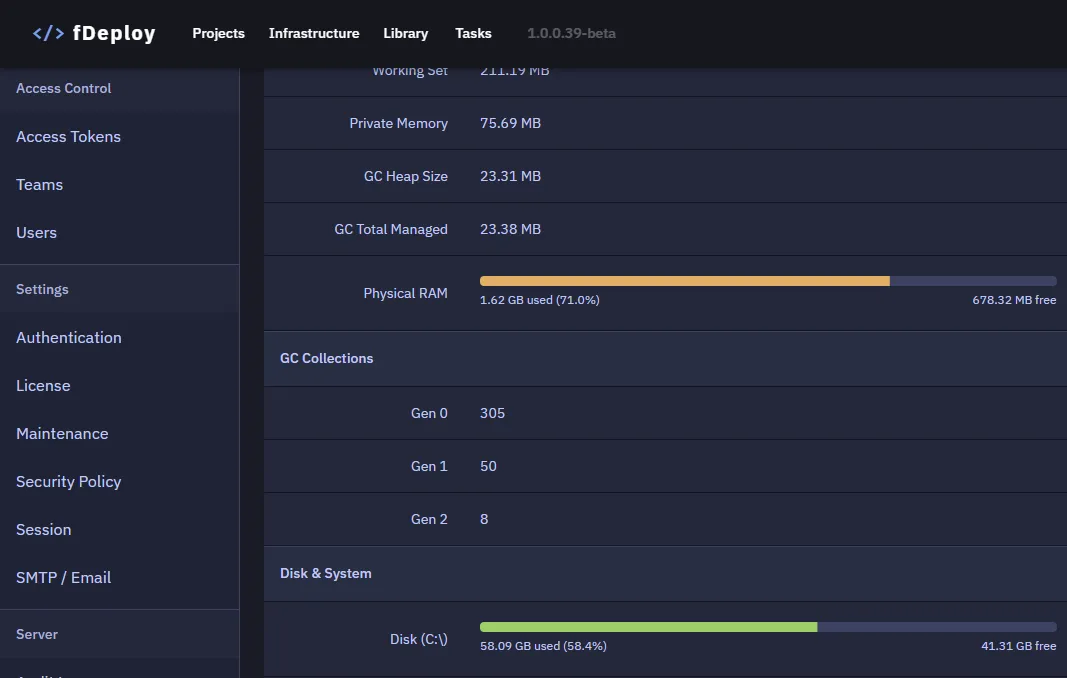
The diagnostics page (Configuration → Diagnostics) is a real-time view of the fDeploy Server process: version, runtime, memory, GC, disk, thread count, and aggregate counts of fDeploy resources (environments, targets, projects, releases, etc.). It is accessible only to users with the System Administrator role.
The dashboard auto-refreshes every 30 seconds — you can leave it open for live monitoring.
Server logs
The bottom section renders the on-disk server log file selected from the date dropdown. Log entries are prefixed with a three-letter severity code:
| Code | Severity |
|---|---|
FTL | Fatal |
ERR | Error |
WRN | Warning |
INF | Informational |
DBG | Debug |
The severity-filter chips in the log header toggle visibility per severity — useful for filtering out INF/DBG noise when chasing an error. Logs are not auto-refreshed; click Refresh to reload the file after the next write.